A coding-agent demo answers whether a tool can complete one visible task. A production evaluation must answer a harder question: does the tool improve durable engineering output for this team after review, failures, and cost are included?
The answer changes by repository, task type, developer experience, workflow, and model version. Research already points in different directions. A 2026 Microsoft field study linked command-line agent adoption to roughly 24% more merged pull requests, while a METR randomized study of experienced open-source developers using early-2025 tools found a slowdown in its tested setting. Those results are not mutually exclusive; they measured different people, tools, tasks, and outcomes.
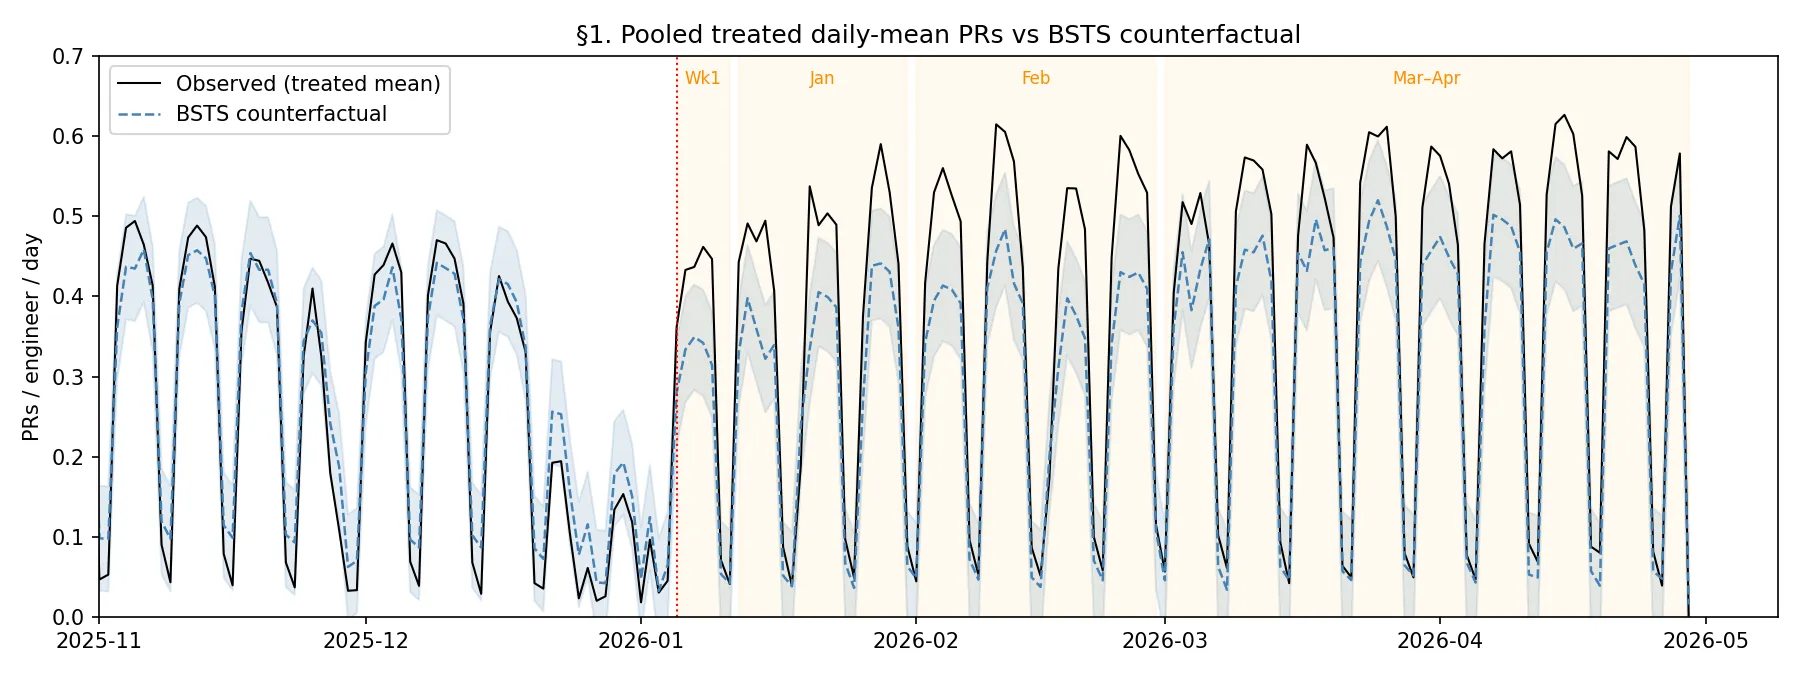
Figure: Microsoft’s adopter cohort merged more pull requests than its modeled counterfactual, but the study treats merged PRs as an output proxy rather than a complete productivity measure. Source: Murphy-Hill, Butler, and Savelieva, CC BY 4.0.
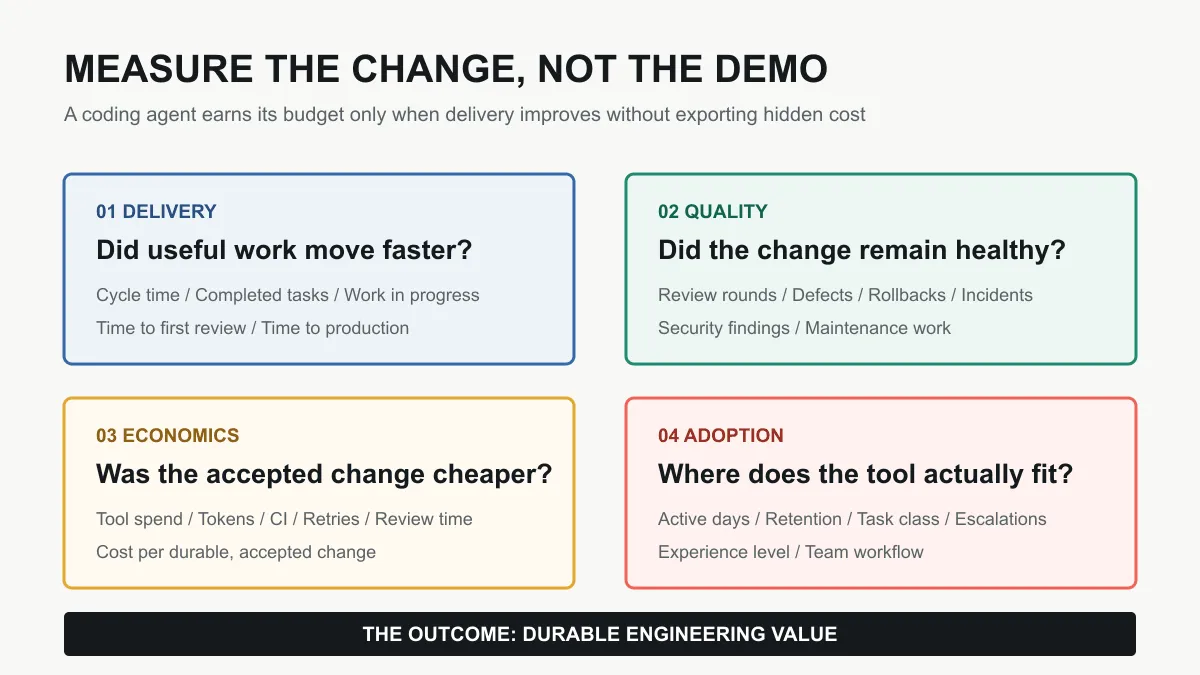
Use a balanced scorecard rather than importing one headline percentage.
Start with the decision
Write the decision the evaluation will support before choosing tasks.
Examples:
- Should the company purchase seats for all engineers or only selected teams?
- Which agent should handle repository maintenance work?
- Can an agent prepare low-risk pull requests without synchronous supervision?
- Which model and reasoning setting minimizes cost per accepted change?
- What controls are required before the agent can run tests or modify infrastructure?
A benchmark without a decision becomes a product tour. A clear decision determines the necessary evidence and prevents the winning metric from changing after results appear.
Build a representative task set
Sample work from the repository rather than relying only on synthetic coding problems.
Stratify tasks by:
- Bug fix, feature, refactor, test, documentation, migration, and investigation.
- Small local change versus cross-module change.
- Familiar code versus unfamiliar subsystem.
- Deterministic acceptance test versus judgment-heavy review.
- Low-risk application code versus security- or data-sensitive code.
- Greenfield work versus maintenance in a mature codebase.
Record expected difficulty and required context before the agent begins. Avoid selecting only tasks that already look easy to automate.
Keep a separate challenge set for regression testing after model, prompt, tool, or repository changes.
Measure delivery without rewarding churn
Pull-request count and lines changed are easy to collect and easy to game. Pair throughput with time and acceptance.
Useful delivery metrics include:
- Time from task start to first reviewable change.
- End-to-end cycle time to production or closure.
- Completed tasks per engineer or team.
- Work in progress and stalled-task rate.
- Percentage of agent attempts that reach human review.
- Percentage of reviewed attempts that are accepted.
The Microsoft CLI study used merged PRs as an output proxy and explicitly warned that a merge does not equal business value. Our analysis of the 24% result covers its design, credible interval, adoption effects, and limitations.
Measure quality after the merge
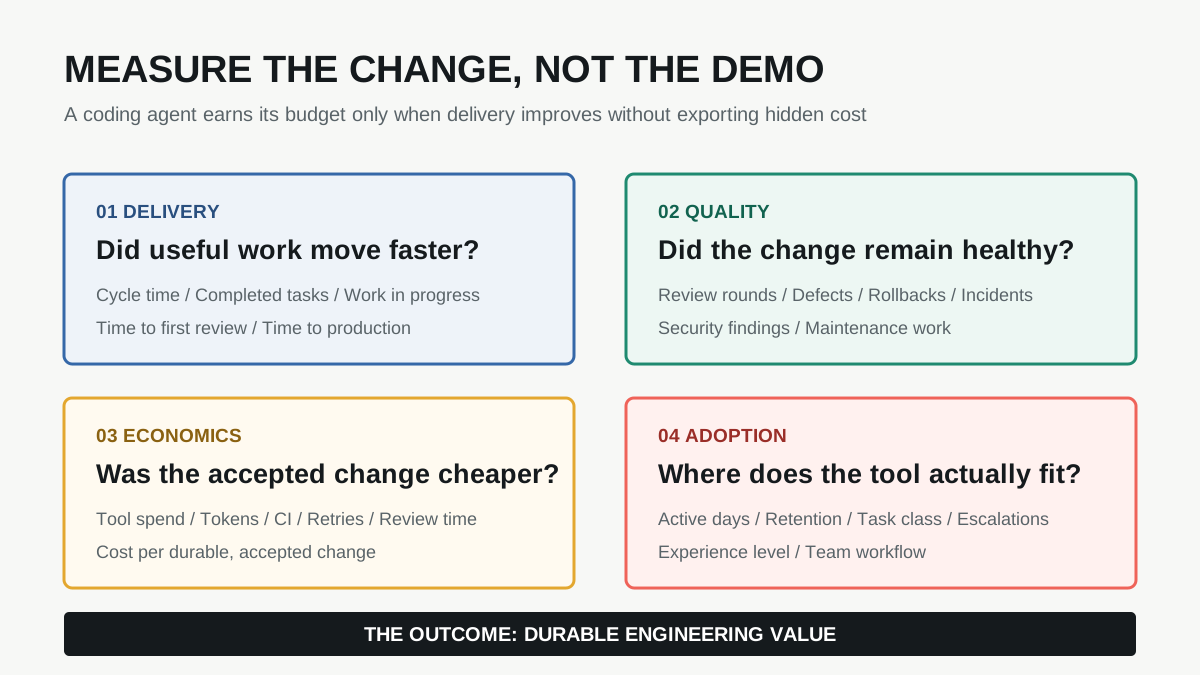
Figure: Delivery, durability, review effort, cost, adoption, and risk must be measured together. Yield Signal Daily editorial diagram.
An agent can move effort from implementation to review, debugging, or maintenance. Track whether the accepted change remains healthy.
At minimum, collect:
- Review rounds and reviewer minutes.
- Test failures introduced during the attempt.
- Defects, rollbacks, and incidents after merge.
- Security and dependency findings.
- Code duplication, complexity, and unnecessary surface area.
- Follow-up work attributed to the change.
Use a fixed observation window and the same attribution rules across agent-assisted and comparison tasks. A fast merge followed by two days of cleanup is not a productivity win.
For high-risk repositories, require security review and threat-model checks before increasing autonomy. The production agent security checklist provides a separate deployment gate.
Calculate total cost per durable change
Seat price is only one cost component.
total cost =
  subscription or API spend
  + model input/output and cache charges
  + CI and sandbox compute
  + retry and failed-attempt cost
  + developer supervision time
  + reviewer time
  + incident and rework cost
Divide total cost by accepted changes that remain valid through the observation window. Also report the distribution: one runaway task can matter operationally even when average cost looks acceptable.
Track latency alongside cost. A cheaper model that requires repeated correction may produce worse cycle time and a higher final cost.
Our GPT-5.6 cost and reasoning analysis shows why model choice, reasoning effort, and retries should be measured independently.
Measure adoption by task, not only by user
License activation does not reveal where the tool provides value. Capture:
- First use, weekly active use, and retention.
- Agent-use days and task categories.
- Percentage of an attempt delegated to the agent.
- Manual takeovers and escalation reasons.
- Team, repository, and developer experience level.
- Reusable instructions, tools, and workflows created by the team.
Adoption can spread through peers. The Microsoft CLI study found strong associations between coworker exposure and first use. That suggests evaluations should observe team workflows, not only isolated users.
At the same time, self-reported speed is not enough. Developers may feel faster while spending more elapsed time, or feel slower while producing better-tested changes. Collect perceptions, but compare them with telemetry.
Use a controlled rollout design
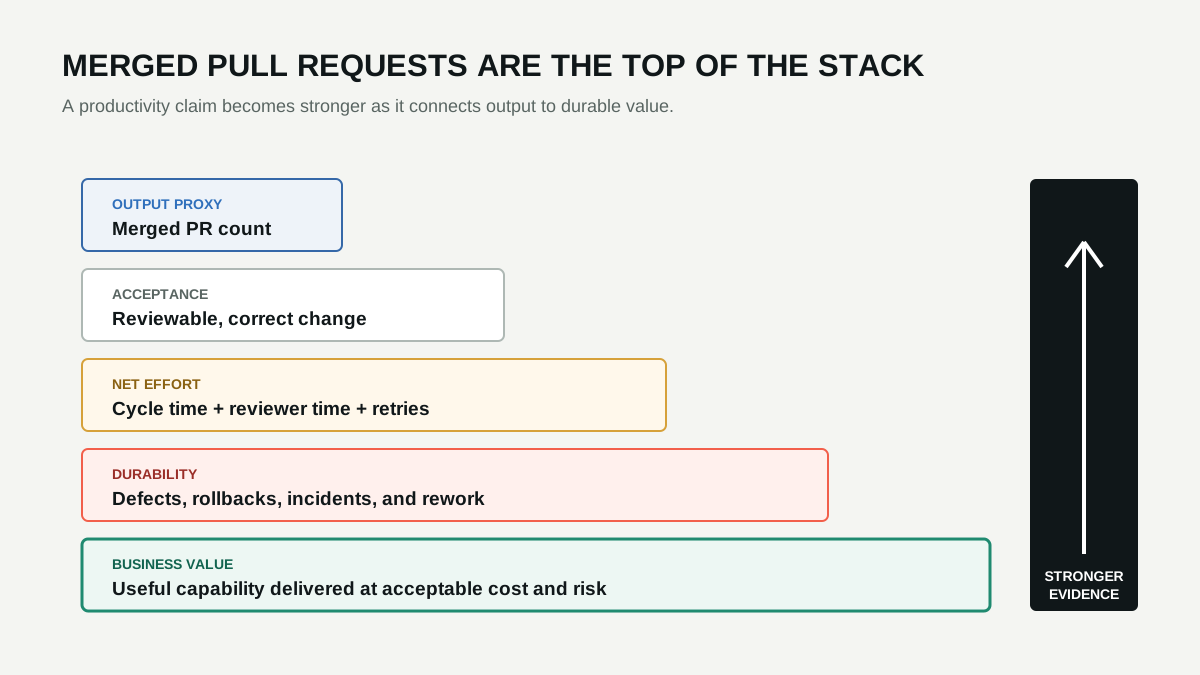
Figure: Strong productivity evidence connects output volume to net effort, durability, cost, risk, and useful outcomes. Yield Signal Daily editorial diagram.
A perfect randomized trial is often impractical inside one company, but the evaluation can still reduce bias.
Before-and-after with a comparison group
Measure teams before rollout and compare changes with similar teams that have not yet adopted the tool. Document release cycles, staffing, and project changes that could affect outcomes.
Staggered rollout
Introduce the agent to groups at different times. This creates natural comparison windows and limits blast radius.
Matched task replay
Use previously completed tasks with known acceptance tests. Prevent data leakage where possible and label tasks the model may already have seen.
Within-person task comparison
Compare the same developer across matched task types, while recognizing that tool use may be chosen for easier or more automatable work.
Do not combine unlike designs into one certainty score. Report what each design can and cannot establish.
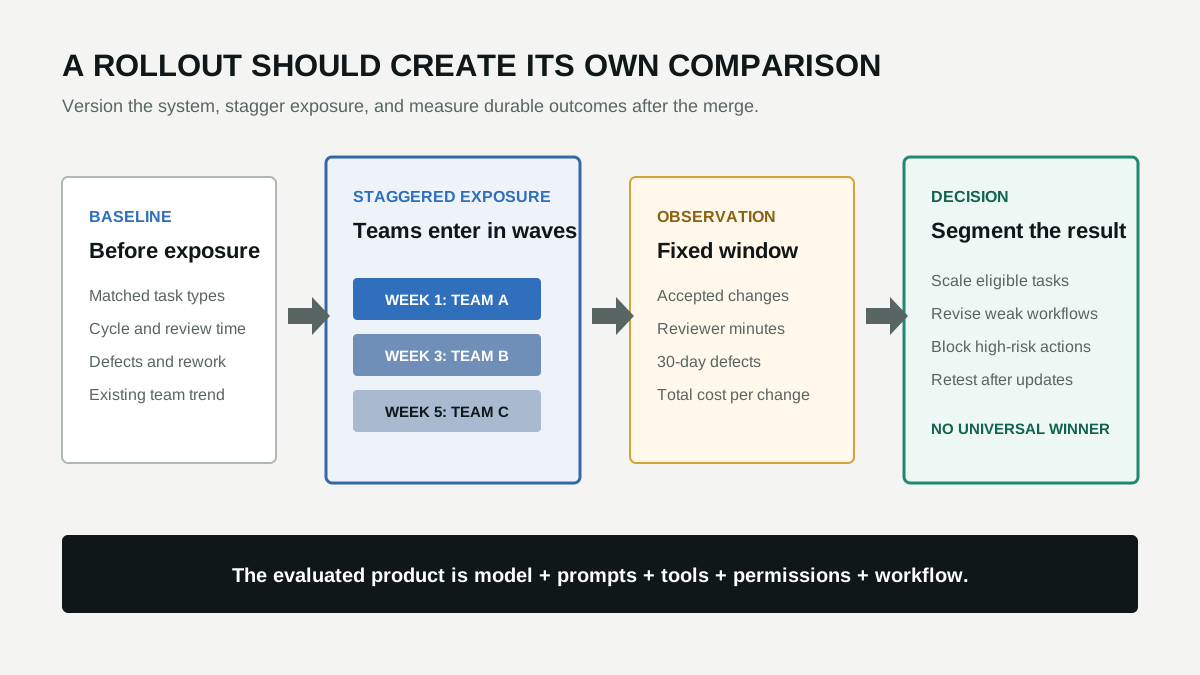
Figure: Staggered exposure creates comparison windows while a fixed observation period captures review cost, defects, and durable outcomes. Yield Signal Daily editorial diagram.
Keep the configuration versioned
The evaluated system includes more than the model name. Version:
- Model and reasoning settings.
- System and repository instructions.
- Tool permissions and sandbox policy.
- Context and retrieval strategy.
- Retry and token budgets.
- Test and review workflow.
- Evaluation dataset and scoring rubric.
A backend update can change behavior without changing the product name. Preserve timestamps and rerun the challenge set after material changes.
A practical rollout threshold
Define thresholds before reviewing results. For example:
- At least 15% lower median cycle time on eligible tasks.
- No statistically or operationally meaningful increase in defects.
- Reviewer time does not rise by more than 5%.
- Total cost per durable change stays below the team’s target.
- No critical policy bypass in the security test set.
- At least 40% four-week retention among the target cohort.
The exact numbers should match the organization. The important part is that quality and risk cannot be traded away silently after a strong throughput result.
Report a segmented conclusion
Avoid declaring one agent “best.” State where it was useful.
A defensible result looks like this:
In this repository and configuration, the agent reduced cycle time for small test-backed maintenance tasks. It did not improve cross-service features, increased review time for unfamiliar modules, and was not authorized for infrastructure changes. Cost per accepted maintenance change fell, while defect rates were unchanged during the observation window.
That conclusion is narrower than a leaderboard, but it can support procurement, policy, and workflow decisions.